Solutions / Explainable AI evaluation
Explainable AI evaluation
Is your AI making correct decisions, and for the right reasons? We evaluate it with established methods such as LIME, SHAP and Grad-CAM, and with custom questionnaire applications that collect expert feedback on its decisions.
What it is
- LIME: fits a simple, readable model around one prediction to show which inputs influenced it locally.
- SHAP: attributes a prediction to its input features using Shapley values from cooperative game theory.
- Grad-CAM: for convolutional networks, uses gradients to highlight the image regions that drove a decision.
- Expert questionnaires: a custom application that collects structured judgments from your domain experts on decisions and explanations.
Where it fits
- Models that reach high accuracy, where you need to know whether they decide for sound reasons.
- Safety-relevant or regulated decisions that require evidence of how a model behaves.
- Teams that need domain experts to review model behavior in a structured way.
How an evaluation runs
The structure follows the three levels of evaluation described by Doshi-Velez and Kim: with experts on the real task, with people on simplified tasks, and with proxy measures.
-
1
Select cases
Correct, incorrect and low-confidence decisions, covering the conditions that matter to you.
-
2
Generate explanations
Apply the methods that fit your model type and data.
-
3
Collect expert judgments
Your experts rate decisions and explanations in the questionnaire application.
-
4
Analyze
Find decisions that are right for the wrong reasons and wrong with high confidence.
-
5
Report
Findings with examples, likely causes and recommendations.
Same accuracy, different reasons
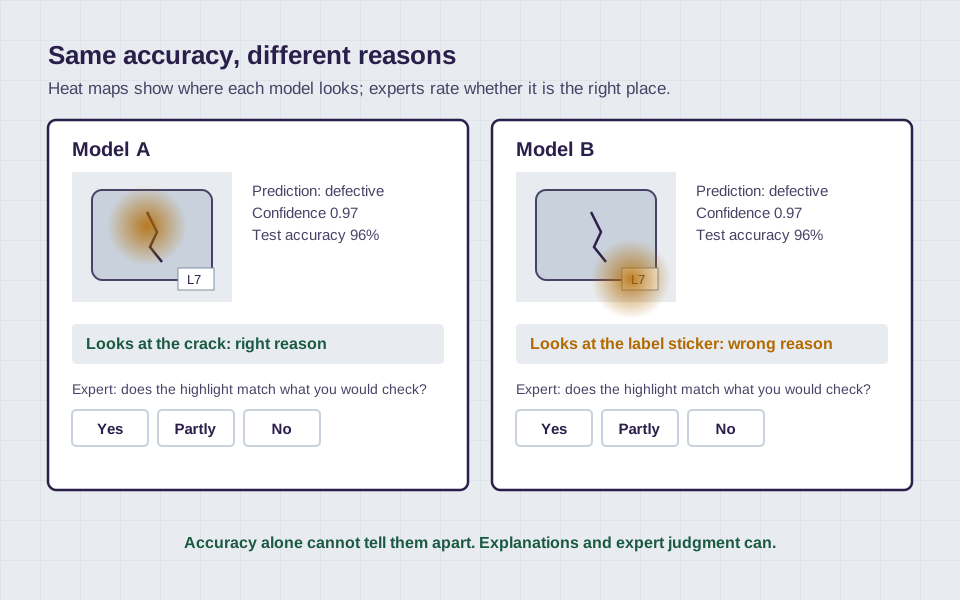
Two models reach the same accuracy on the test set. In the training data, defective parts happened to carry the label L7. Show the heat maps to see where each model looks, then act as the expert and rate each one.
Model A
Prediction: defective, confidence 0.97
Test accuracy: 96%
Expert question: does the highlighted region match what you would look at?
Responses: Yes 0, Partly 0, No 0
Model B
Prediction: defective, confidence 0.97
Test accuracy: 96%
Expert question: does the highlighted region match what you would look at?
Responses: Yes 0, Partly 0, No 0
Illustrative example with a drawn image and idealized heat maps.
Methods and references
- Ribeiro, Singh, Guestrin (2016). Why Should I Trust You? Explaining the Predictions of Any Classifier. LIME. arXiv:1602.04938
- Lundberg, Lee (2017). A Unified Approach to Interpreting Model Predictions. SHAP. arXiv:1705.07874
- Selvaraju et al. (2017). Grad-CAM: Visual Explanations from Deep Networks via Gradient-based Localization. arXiv:1610.02391
- Doshi-Velez, Kim (2017). Towards A Rigorous Science of Interpretable Machine Learning. arXiv:1702.08608
Get it your way
NDA available on request.
License it
- Closed source, licensed for your use: device-specific license key or online authentication
- An evaluation version first, so you can test it in your own environment
- License terms agreed to fit your requirements and budget
Have it built
- Designed around your system and your problem
- Built from scratch, or adapted from an existing solution
- Source code and IP stay with you, with documentation and a handover